환리스크란?(무역회사의 입장)
환리스크란 예상치 못한 환율의 변동 등으로 기업이나 경제주체가 손실을 입을 가능성의 정도를 말하며, 특히 무역회사의 경우 계약 후 수출/입이 실제로 일어나서 대금을 받거나 결제할 때까지의 시차가 발생하는데 이때 발생하는 환율변동위험이 대개 무역회사의 실질적 환리스크임

환리스크 관리의 필요성
기업의 연속성
수출/입 기업의 경우 간혹 급격한 환율변동 때문에 당초 사업계획상의 수익달성에 실패할 수 있고, 이로 인해기업의 존폐마저 위협(키코사건)
코스닥상장 T사 환차손익 현황 (미관리업체 사례)
구분 |
2008년 |
2009년 |
2010년 |
2011년 상반기 |
|---|---|---|---|---|
매출액 |
80,058,229,529 |
91,348,347,848 |
98,384,956,855 |
28,520,590,054 |
영업이익 |
-6,355,431,407 |
2,572,328,742 |
-10,951,177,388 |
2,344,237,184 |
영업외수익 |
25,314,515,882 |
8,317,166,648 |
3,934,502,294 |
|
영업외비용 |
10,003,083,059 |
10,718,023,855 |
10,615,672,000 |
|
세전이익 |
8,956,001,416 |
171,471,535 |
-17,632,347,094 |
2,182,385,025 |
환차익액 |
24,458,114,962 |
5,162,147,890 |
2,218,649,400 |
2,511,116,342 |
환차손액 |
4,468,686,580 |
8,084,162,870 |
8,121,003,129 |
862,468,325 |
환차손익 |
19,989,428,38 |
-2,922,014,980 |
-5,902,353,729 |
1,648,648,017 |
환차손익/세전이익 |
223.2% |
-1704.1% |
33.5% |
75.5% |
(단위:원)
유가증권상장 HM사 환차손익 현황 (관리업체 사례)
구분 |
2008년 |
2009년 |
2010년 |
2011년 상반기 |
|---|---|---|---|---|
매출액 |
32,189,786,000,000 |
31,859,327,000,000 |
36,769,426,000,000 |
20,312,687,000,000 |
영업이익 |
1,877,218,000,000 |
2,234,962,000,000 |
3,226,617,000,000 |
2,100,919,000,000 |
영업외수익 |
1,509,764,000,000 |
2,567,705,000,000 |
3,904,692,000,000 |
|
영업외비용 |
1,591,970,000,000 |
1,021,355,000,000 |
823,416,000,000 |
|
세전이익 |
1,795,012,000,000 |
3,781,312,000,000 |
6,307,893,000,000 |
3,131,730,000,000 |
환차익액 |
311,461,000,000 |
85,627,000,000 |
93,474,000,000 |
972,076,000,000 |
환차손액 |
560,536,000,000 |
140,831,000,000 |
130,464,000,000 |
759,307,000,000 |
환차손익 |
-249,075,000,000 |
-55,204,000,000 |
-36,990,000,000 |
212,769,000,000 |
환차손익/세전이익 |
-13.9% |
-1.5% |
-0.6% |
6.8% |
(단위:원)
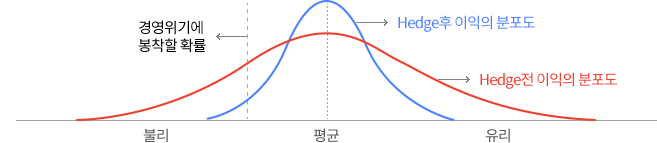
극단적 환율움직임의 방어
장기적으로 경기가 순환하는 구조상 경기호황에서 불황으로 넘어가는 시기에 급격하게 자산가격 거품이 붕괴되면서 환율의 급등이 발생함
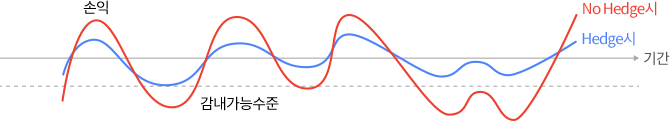
최소한의 유통마진 확보(환차손익의 평준화)
보통 무역회사 중 중개를 주업으로 하는 회사는 마진폭이 작음. 일시적으로 급격한 환율변동 발생시 오히려 손실을 보는 경우가 발생
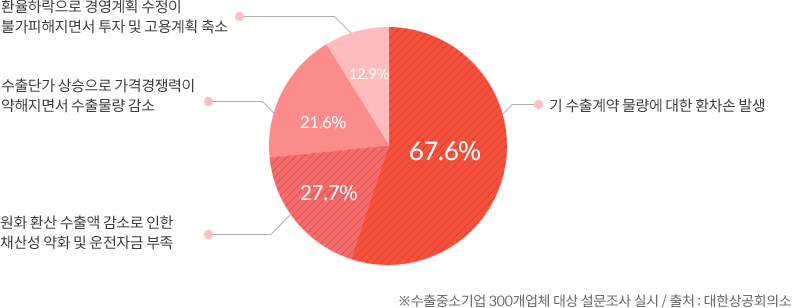
환리스크를 방치한 기업들은 다양한 피해유형에 노출